Ghost Town on the Blockchain: How to Spot a Crypto Project Hemorrhaging Holders Before It Flatlines

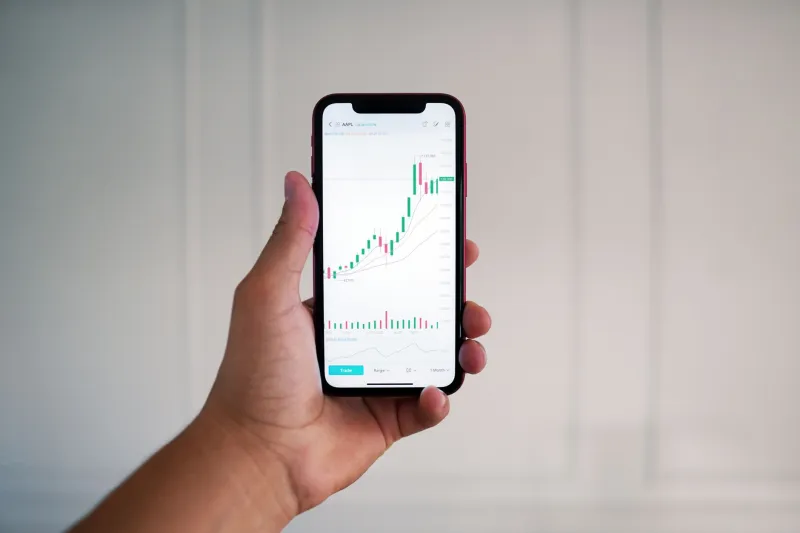
Photo by Photo by Arturo Añez on Unsplash on Unsplash
There's a specific kind of silence that settles over a dying crypto project. It's not the peaceful silence of a coin patiently biding its time. It's the eerie, post-apocalyptic quiet of a Discord server where the last message was posted forty-three days ago and the pinned announcement still says "BIG NEWS COMING SOON." The wallets have gone dark. The volume has evaporated. And somewhere out there, a dev is definitely not on a beach in the Cayman Islands.
Holder exodus is one of the most predictable — and most ignored — warning signs in the entire crypto universe. The data is sitting right there on-chain, free to read, screaming at anyone willing to look. But most investors don't look until the price has already cratered 80% and their portfolio resembles a crime scene photo. So let's fix that. Here's how to read the departure lounge before the plane crashes.
The Holder Count Trap: Why Vanishing Wallets Tell the Real Story
Every halfway-decent blockchain explorer will show you holder count data, and most of the time, retail investors glance at it once and move on. Big mistake. Holder count isn't just a vanity metric — it's a living, breathing pulse monitor for the community behind a token.
A healthy project shedding 5–10% of holders during a broader market downturn? Totally normal. People panic-sell, life happens, Elon tweets something weird. But a project losing 30%, 40%, or 60% of its wallet addresses over a rolling 90-day window while the broader market is flat or rising? That's not volatility. That's evacuation.
The trick is to look at the rate of departure, not just the raw number. A slow, steady bleed is often more dangerous than a sharp single-day drop, because it suggests holders aren't reacting to one bad event — they're gradually losing faith in something fundamental. That's the difference between a stubbed toe and a slow-motion collapse.
Dormancy Patterns: When Wallets Stop Moving Entirely
Here's where it gets genuinely interesting for the data nerds among us. On-chain analytics platforms like Nansen, Glassnode, and Bubblemaps let you track wallet activity over time — specifically, how many wallets holding a given token have made zero transactions in the last 30, 60, or 90 days.
Some wallet dormancy is fine. Long-term holders exist. Diamond hands are a real phenomenon, even if they're occasionally just people who lost their seed phrases. But when dormancy spikes sharply and new wallet activity simultaneously dries up, you've got a problem that goes beyond HODLing. You've got abandonment.
Pay particular attention to the mid-tier wallet cohort — addresses holding somewhere between 0.1% and 1% of the supply. These are often your most informed retail participants: people who did actual research, deployed meaningful capital, and have enough skin in the game to pay attention. When this group goes quiet or starts distributing, it's worth treating as a five-alarm fire rather than a Tuesday.
Volume Shifts and the Liquidity Death Spiral
Trading volume is the heartbeat of any liquid asset, and in crypto, it's also one of the first things to flatline when a project is circling the drain. But raw volume numbers can be deceiving — especially in meme coin land, where wash trading, bot activity, and coordinated pumps can inflate volume metrics enough to make a dying project look temporarily alive.
What you want to watch instead is organic volume consistency. Is daily trading volume declining week-over-week even during periods when similar tokens are seeing increased activity? Are the buy-side transactions getting smaller in average size while sell-side transactions remain large? That asymmetry — small buys, big sells — is a textbook sign of distribution: the people who know something are getting out while retail keeps trickling in.
Also worth checking: the ratio of unique wallet addresses initiating trades versus repeat addresses. A healthy project sees a mix of new entrants and returning traders. A dying one starts looking like the same twelve wallets trading back and forth while everyone else has quietly left the building.
Holder Distribution Charts: The Whale Concentration Red Flag
Holder distribution charts are criminally underutilized by the average retail investor, which is a shame because they're basically a treasure map for avoiding disasters. Pull up any token on a platform that shows wallet concentration — how much of the total supply is held by the top 10, top 50, or top 100 wallets.
Here's what a mass exodus often looks like in distribution terms: the top holders' percentage increases even as overall holder count drops. That sounds counterintuitive, but it makes perfect sense when you think it through. As smaller retail holders exit, their tokens consolidate back into fewer, larger wallets — often the original team, early investors, or opportunistic accumulators waiting for a final pump before their own exit. When whale concentration climbs while retail participation falls, you're watching the setup for a final distribution event. And you don't want to be on the receiving end of that one.
Normal Volatility vs. The Death Knell: Drawing the Line
Okay, so not every holder drop means your coin is dead. Crypto markets are volatile, markets cycle, and sometimes good projects lose holders during bear phases only to rebuild during the next run. So how do you distinguish healthy attrition from terminal decline?
A few practical checkpoints:
Developer activity: Is the GitHub still being updated? Are there recent commits, audits, or product releases? A project losing holders but actively building is in a very different position than one losing holders with a dev team that hasn't pushed code in four months.
Community sentiment shift: There's a qualitative difference between a community that's frustrated-but-engaged and one that's gone silent. Frustrated communities argue, complain, and post angry memes. Dead communities just... stop. Check when the last 100 Discord messages were posted. If it looks like a time capsule, act accordingly.
Correlation with the broader market: Did your token's holder exodus coincide with a 40% Bitcoin drawdown that hit the whole market? Or did it happen while everything else was green? Timing matters enormously when assessing whether you're dealing with macro-driven selling or project-specific collapse.
Token utility changes: Has the project removed or deprecated key features? Changed tokenomics in a way that disadvantages current holders? Announced pivots that invalidate the original thesis? Structural changes that hurt holders are often the invisible trigger behind sudden departure waves.
The Bottom Line: The Data Doesn't Lie, But You Have to Actually Read It
The brutal reality of crypto investing is that the warning signs are almost always visible in retrospect — and often visible in real time, too, if you're willing to do the work. Holder exodus doesn't happen overnight. It's a process, and that process leaves tracks all over the blockchain for anyone patient enough to follow them.
Before you reassess your position in any project, run the checklist: holder count trends, dormancy spikes, volume asymmetry, whale concentration shifts, and developer activity. None of these signals is a magic oracle. All of them together paint a picture worth paying attention to.
Because the difference between getting out at minus 40% and getting out at minus 95% is usually just a matter of whether you checked the data before the ghost town became obvious to everyone else.