Your Meme Coin Is Up 1000% and You're Still Broke: The Liquidity Illusion Nobody Warned You About

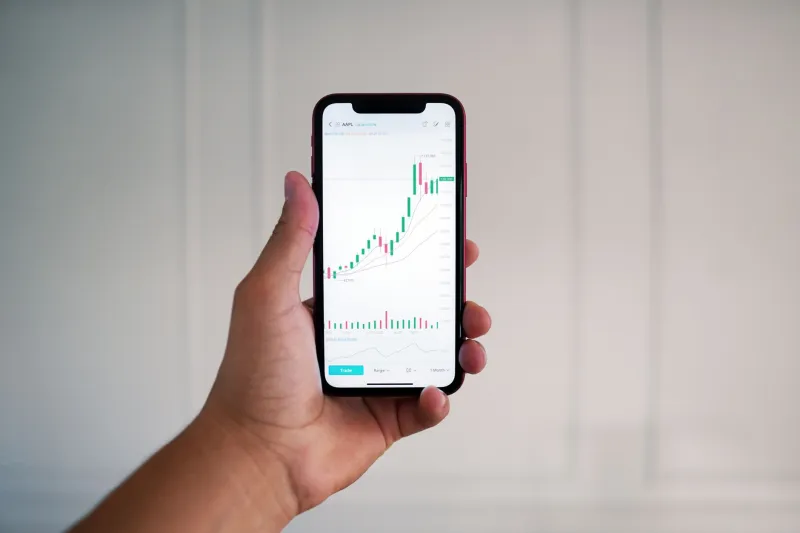
Photo by Photo by Terrillo Walls on Unsplash on Unsplash
Picture this: You ape into a meme coin at 2 AM because a guy named CryptoWizard88 posted a rocket emoji on Telegram. Three days later, you open the chart and nearly fall out of your chair. The thing is up 1,000%. You are, by every metric your sleep-deprived brain can process, a genius.
Then you try to sell.
And that's where the meme coin universe reveals its most vicious punchline.
Welcome to the liquidity trap — the silent portfolio killer that's been stealing wins from retail traders since the first dog-themed token launched on a decentralized exchange. Understanding this concept won't make you rich overnight, but it might stop you from being spectacularly poor in a way that's technically your own fault.
What Even Is Liquidity, and Why Should You Care?
In plain English, liquidity is the ability to buy or sell an asset at a stable price without moving that price dramatically in the process. Think of it like trying to sell a car. If you list a Honda Civic, you'll get offers quickly and close to your asking price because there's a deep market of buyers. Now imagine trying to sell a 1987 novelty vehicle shaped like a giant hot dog. There's technically a price on it. Whether anyone will pay that price is a completely different conversation.
Most meme coins on decentralized exchanges like Uniswap or Raydium live in hot dog car territory. They trade against a liquidity pool — a shared pot of funds that other traders have deposited to facilitate swaps. When that pool is shallow, even modest buy and sell orders can swing the price dramatically. This is how a single $500 buy can pump a token 40%, and why that pump means almost nothing about what you'll actually receive when you try to exit.
The Slippage Problem Is Worse Than You Think
Slippage is the difference between the price you see on screen and the price you actually get when your trade executes. On a coin with deep liquidity — think Bitcoin or Ethereum — slippage is measured in fractions of a percent. Annoying, but manageable.
On a freshly launched meme coin with a $50,000 liquidity pool? Slippage can eat 10%, 20%, sometimes 50% of your transaction value. You set your slippage tolerance high because the transaction keeps failing otherwise, and in doing so you've essentially told the protocol: "I accept whatever price you feel like giving me." That's not trading. That's just handing your money to a slot machine and asking nicely.
Here's the kicker: the chart you're staring at reflects the last executed trade, not what you'll get on the next one. That beautiful price on the screen is a historical artifact. Your trade will reshape it the moment it hits the pool.
Reading a Bid-Ask Spread When There Barely Is One
Traditional markets have market makers — professional entities whose entire job is to sit on both sides of a trade and keep the spread tight. Decentralized exchanges don't work that way. The "spread" on a low-liquidity meme coin is effectively the gap between what the automated market maker algorithm will give you to buy versus what it'll give you to sell, and on thin pools that gap can be jaw-dropping.
Let's say a coin is "priced" at $0.0001. You might be able to buy it at $0.000115 and immediately sell it back for $0.000085. That's a 26% round-trip loss before you've even had time to regret your decision. The chart shows $0.0001. Your wallet shows a story of quiet financial suffering.
This is why screenshots of meme coin gains are almost always taken from the chart and almost never from an actual sell confirmation.
The Math of Exiting When Nobody's Buying
Let's run a scenario that will make your stomach hurt in a productive way.
You buy $1,000 worth of $BONKDOGE at launch. The pool has $30,000 in total liquidity. Your buy moves the price noticeably, but you're in early. Over the next 48 hours, hype builds, more people pile in, and the chart shows your position is now worth $11,000. You're up 1,000%. You start mentally pricing out a new couch.
Now you try to sell your $11,000 position into a pool that, even after all the buying activity, only holds $80,000 in liquidity. Your sell order represents roughly 13% of the entire pool. The automated market maker's pricing formula — typically a constant product model — means your sell will tank the price progressively as it executes. By the time your order fills, you might receive $6,000. Maybe $5,000. The chart briefly showed $11,000, but the market never actually had $11,000 waiting for you. It was a number on a screen, not a promise.
Now multiply this problem by the fact that every other early buyer has the same idea at the same time, and you start to understand why meme coin exit windows are measured in minutes, not days.
How to Protect Yourself Without Becoming a Paranoid Hermit
None of this means meme coins are entirely untradeable. It means they require a specific kind of discipline that most people don't bring to the table at 2 AM when CryptoWizard88 is posting rockets.
Check the liquidity pool depth before you buy. On most DEX interfaces, you can see the total value locked in a pool. If it's under $100,000, treat every price signal as provisional at best.
Set a realistic exit target based on pool size, not chart price. Ask yourself: if I try to sell my full position, what percentage of the pool am I moving? Anything above 5% should make you nervous. Anything above 10% means you should be planning to exit in multiple smaller tranches over time.
Use limit orders where platforms support them. Some newer DEX aggregators offer limit order functionality that lets you specify a minimum acceptable price rather than accepting whatever the pool gives you.
Treat slippage tolerance settings seriously. A high slippage setting is sometimes necessary to get a transaction through, but it's also an invitation for sandwich attacks — where bots front-run your transaction, pump the price, execute your trade at the inflated price, then sell immediately after. Welcome to the jungle.
Size positions in relation to liquidity, not in relation to your excitement level. If the pool is $50,000 and you're trying to put in $5,000, you are not a retail trader. You are the market.
The Chart Is Not the Asset
The deepest trap in all of this is psychological. Charts are compelling. Green candles feel like validation. A number that says you're up 1,000% produces the same neurological response as winning a scratch ticket, regardless of whether that number is real in any practical sense.
Meme coin trading rewards people who understand that the chart is a representation of the last trade that happened, not a guarantee of the next one. The asset you actually hold is only as valuable as the liquidity available to absorb your exit.
That 1,000% gain is real the moment it hits your wallet in USDC. Until then, it's a very pretty number on a screen — and the market has absolutely no obligation to let you convert it.
Trade accordingly. And maybe get some sleep before you ape in next time.